Amazing Python Package Showcase (3) – Pyodide
In the third article of my Amazing Python Package Showcase, let’s explore Pyodide, a groundbreaking tool that brings the power of Python to the browser. This innovative package allows you to run Python and its scientific stack directly in the web environment, opening up new possibilities for interactive applications and scientific computing on the web.
Table of Contents
What is Pyodide?
Pyodide is a project that aims to bring the Python runtime to the browser by leveraging WebAssembly. It includes the CPython interpreter compiled to WebAssembly and an extensive collection of Python packages commonly used in data science, such as NumPy, Pandas, Matplotlib, and more.
Key Features of Pyodide
Python in the Browser
Pyodide allows you to run Python code directly in the browser. This means you can leverage Python’s extensive libraries and tools without needing to set up a server or backend. It’s particularly useful for educational purposes, tutorials, and interactive coding environments.
Comprehensive Package Support
Pyodide comes with a wide range of pre-compiled Python packages, making it easy to perform data analysis, scientific computing, and more, directly in the browser. Some of the included packages are:
- NumPy
- Pandas
- Matplotlib
- Scipy
- Scikit-learn
Interoperability with JavaScript
One of Pyodide’s most powerful features is its seamless interoperability with JavaScript. You can call JavaScript functions from Python and vice versa, allowing you to build rich, interactive web applications that leverage the strengths of both languages.
Offline Capabilities
Since Pyodide runs entirely in the browser, it can work offline once the necessary files are loaded. This is a significant advantage for developing applications that need to function without a continuous internet connection.
Getting Started
Create and save a test index.html page with the following contents:
<!doctype html>
<html>
<head>
<script src="https://cdn.jsdelivr.net/pyodide/v0.26.1/full/pyodide.js"></script>
</head>
<body>
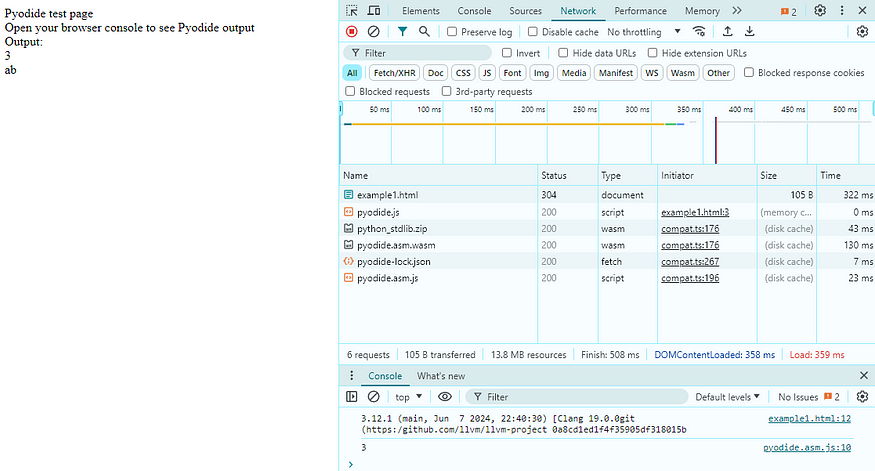
Pyodide test page <br>
Open your browser console to see Pyodide output
<script type="text/javascript">
async function main(){
let pyodide = await loadPyodide();
console.log(pyodide.runPython(`
import sys
sys.version
`));
pyodide.runPython("print(1 + 2)");
const code =
`
a = 1 + 2
b = "a" + "b"
(a, b)
`;
let result = await pyodide.runPython(code);
const [a, b] = result.toJs();
document.getElementById('output_a').innerHTML = a;
document.getElementById('output_b').innerHTML = b;
}
main();
</script>
<div>Output:</div>
<div id="output_a"></div>
<div id="output_b"></div>
</body>
</html>
We can run a simple web server using python:
(myenv) dynotes@P2021:~/projects/python/pyodide$ python -m http.server
Serving HTTP on 0.0.0.0 port 8000 (http://0.0.0.0:8000/) ...
127.0.0.1 - - [02/Jul/2024 19:33:30] "GET /example1.html HTTP/1.1" 304 -
Then access http://localhost:8000/example1.html in a browser
Alternative Example
<!doctype html>
<html>
<head>
<script src="https://cdn.jsdelivr.net/pyodide/v0.26.1/full/pyodide.js"></script>
</head>
<body>
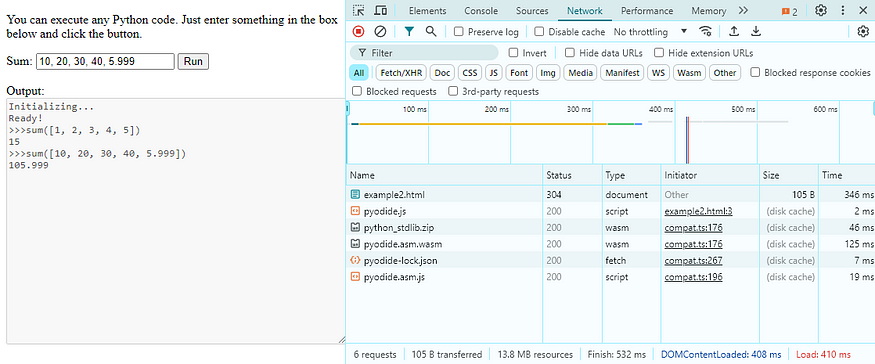
<p>
You can execute any Python code. Just enter something in the box below and
click the button.
</p>
Sum: <input id="code" value="1, 2, 3, 4, 5" />
<button onclick="evaluatePython()">Run</button>
<br />
<br />
<div>Output:</div>
<textarea id="output" style="width: 100%;" rows="6" disabled></textarea>
<script>
const output = document.getElementById("output");
const code = document.getElementById("code");
function addToOutput(s) {
output.value += ">>>sum([" + code.value + "])\n" + s + "\n";
}
output.value = "Initializing...\n";
// init Pyodide
async function main() {
let pyodide = await loadPyodide();
output.value += "Ready!\n";
return pyodide;
}
let pyodideReadyPromise = main();
async function evaluatePython() {
let pyodide = await pyodideReadyPromise;
try {
let output = pyodide.runPython("sum([" + code.value + "])");
addToOutput(output);
} catch (err) {
addToOutput(err);
}
}
</script>
</body>
</html>
Then access http://localhost:8000/example2.html in a browser
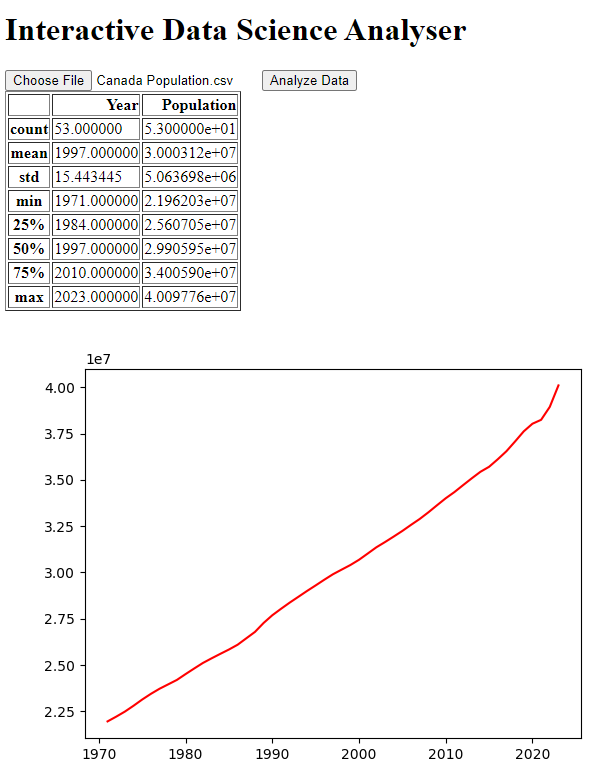
Real Project: Interactive Data Science Analyzer
Let’s build a simple yet powerful interactive data science analyzer using Pyodide. This project will demonstrate how to create a web-based analyzer that allows users to upload a CSV file, perform data analysis, and visualize the results using Python libraries like Pandas and Matplotlib.
The data is extracted from Stats Canada’s Population estimates on July 1, by age and gender. To keep this example code simple, I only keep the two columns — Year and Total Population. You can view and download it at here.
Project Overview
- Project Setup: Create an HTML file with necessary scripts to load
Pyodide. - User Interface: Build a simple UI for file upload and display results.
- Python Code Execution: Use
Pyodideto run Python code for data analysis and visualization. - Result Display: Display the output in the browser.
Step 1: Project Setup
Create an HTML file exmple3.html and include the Pyodide script:
<!DOCTYPE html>
<html lang="en">
<head>
    <meta charset="UTF-8">
    <meta name="viewport" content="width=device-width, initial-scale=1.0">
    <title>Interactive Data Science Analyser</title>
    <script src="https://cdn.jsdelivr.net/pyodide/v0.26.1/full/pyodide.js"></script>
</head>
<body>
    <script>
        async function loadPyodideAndPackages() {
            window.pyodide = await loadPyodide();
            await pyodide.loadPackage(['numpy', 'pandas', 'matplotlib']);
        }
        loadPyodideAndPackages();
    </script>
</body>
</html>
Step 2: User Interface
Add elements for file input and buttons to trigger data analysis. Update the HTML with an area to display the results:
<h1>Interactive Data Science Analyser</h1>
<input type="file" id="fileInput" />
<button onclick="analyzeData()">Analyze Data</button>
Step 3: Python Code Execution
Create a function to read the uploaded file, run data analysis, and visualize the data:
async function analyzeData() {
  const fileInput = document.getElementById('fileInput');
  if (!fileInput.files[0]) {
      alert('Please upload a CSV file');
      return;
  }

  const file = fileInput.files[0];
  const reader = new FileReader();

  reader.onload = async function(event) {
    const csvData = event.target.result;

    const code = `
      import sys
      import matplotlib

      import pandas as pd
      import matplotlib.pyplot as plt

      # Read CSV data
      from io import StringIO
      data = '''${csvData}'''
      df = pd.read_csv(StringIO(data))
      x = df['Year'].to_list()
      y = df['Population'].to_list()
      #print(x)
      #print(y)

      # Perform basic data analysis
      description = df.describe()

      # Plot the data
      fig, ax = plt.subplots()
      ax.plot(x, y, 'r-')

      # Save the plot as a PNG image
      import base64
      from io import BytesIO
      buf = BytesIO()
      plt.savefig(buf, format='png')
      buf.seek(0)
      img_str = base64.b64encode(buf.read()).decode('utf-8')

      (description.to_html(), img_str)
      `;
    let result = await pyodide.runPythonAsync(code);
    const [descriptionHtml, imgStr] = result.toJs();

    document.getElementById('output').innerHTML = descriptionHtml;
    document.getElementById('plot').src = 'data:image/png;base64,' + imgStr;
  };

  reader.readAsText(file);
}
Step 4: Display Results
Update the HTML to display the analysis results and plot:
<div id="output"></div>
<img id="plot" />
Full Code
Here’s the complete example3.html file:
<!DOCTYPE html>
<html lang="en">
<head>
  <meta charset="UTF-8">
  <meta name="viewport" content="width=device-width, initial-scale=1.0">
  <title>Interactive Data Science Analyser</title>
  <script src="https://cdn.jsdelivr.net/pyodide/v0.26.1/full/pyodide.js"></script>
</head>
<body>
  <h1>Interactive Data Science Analyser</h1>
  <input type="file" id="fileInput" />
  <button onclick="analyzeData()">Analyze Data</button>
  <div id="output"></div>
  <img id="plot" />
  <script>
    async function loadPyodideAndPackages() {
        window.pyodide = await loadPyodide();
        await pyodide.loadPackage(['numpy', 'pandas', 'matplotlib']);
    }
    loadPyodideAndPackages();

    async function analyzeData() {
        const fileInput = document.getElementById('fileInput');
        if (!fileInput.files[0]) {
            alert('Please upload a CSV file');
            return;
        }

        const file = fileInput.files[0];
        const reader = new FileReader();

        reader.onload = async function(event) {
            const csvData = event.target.result;

            const code = `
              import sys
              import matplotlib

              import pandas as pd
              import matplotlib.pyplot as plt

              # Read CSV data
              from io import StringIO
              data = '''${csvData}'''
              df = pd.read_csv(StringIO(data))
              x = df['Year'].to_list()
              y = df['Population'].to_list()
              #print(x)
              #print(y)

              # Perform basic data analysis
              description = df.describe()

              # Plot the data
              fig, ax = plt.subplots()
              ax.plot(x, y, 'r-')

              # Save the plot as a PNG image
              import base64
              from io import BytesIO
              buf = BytesIO()
              plt.savefig(buf, format='png')
              buf.seek(0)
              img_str = base64.b64encode(buf.read()).decode('utf-8')

              (description.to_html(), img_str)
            `;
            let result = await pyodide.runPythonAsync(code);
            const [descriptionHtml, imgStr] = result.toJs();

            document.getElementById('output').innerHTML = descriptionHtml;
            document.getElementById('plot').src = 'data:image/png;base64,' + imgStr;
        };

        reader.readAsText(file);
    }
    </script>
</body>

</html>
Run It
Open a browser and access: http://localhost:8000/example3.html


Leave a Reply